Column selectors let users change attributes and measures on a chart or table in dashboards. A report with column selectors allows you to do the following:
- Apply different attributes that are not related in a hierarchy;
- Drill down or up through a hierarchical set of attributes;
- Apply different measures to the same attribute.
Column selectors can reduce the number of reports needed on a dashboard by allowing a single report to do the work of multiple reports.
A column selector applies to a set of attributes and/or a set of measures. You can mix attributes and measures in a column selector. Set up the column selectors in your Visualizer report for use in dashboards.
Create a Column Selector
- Add an attribute and a measure to a report.
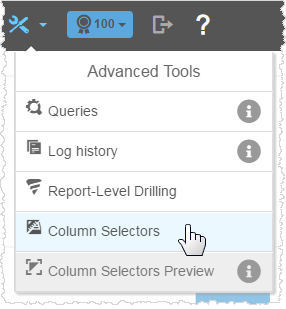
- Click Advanced Tools → Column Selectors.
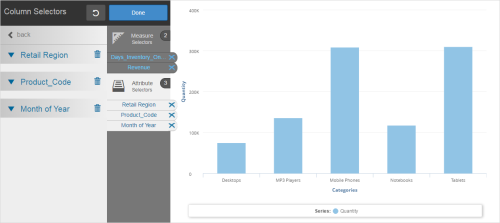
- In the Column Selectors panel, drag and drop an attribute or measure onto the corresponding bucket. The panel updates with the new selector.
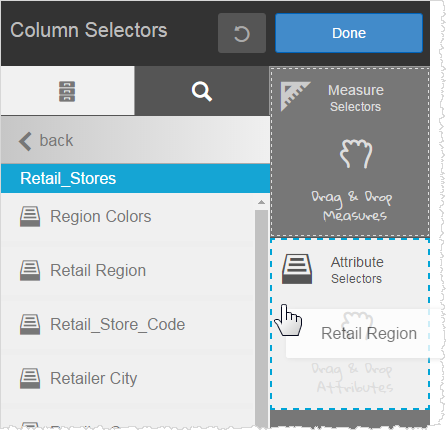
- Optionally, click Back to go to the list and add more attributes or measures.
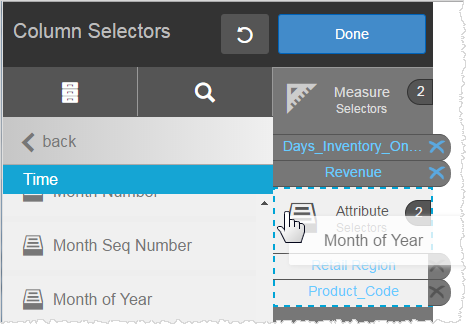 Tip: You do not have to add measures or attributes as column selectors.Tip: Click X to delete an attribute or measure from a bucket.
 - Click Done.
- Click Save.
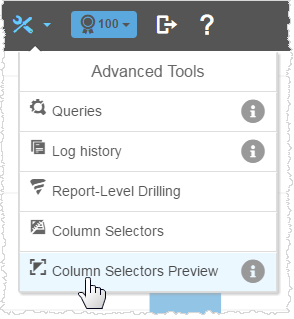
- Click Advanced Tools → Column Selectors Preview to see the new selectors.